
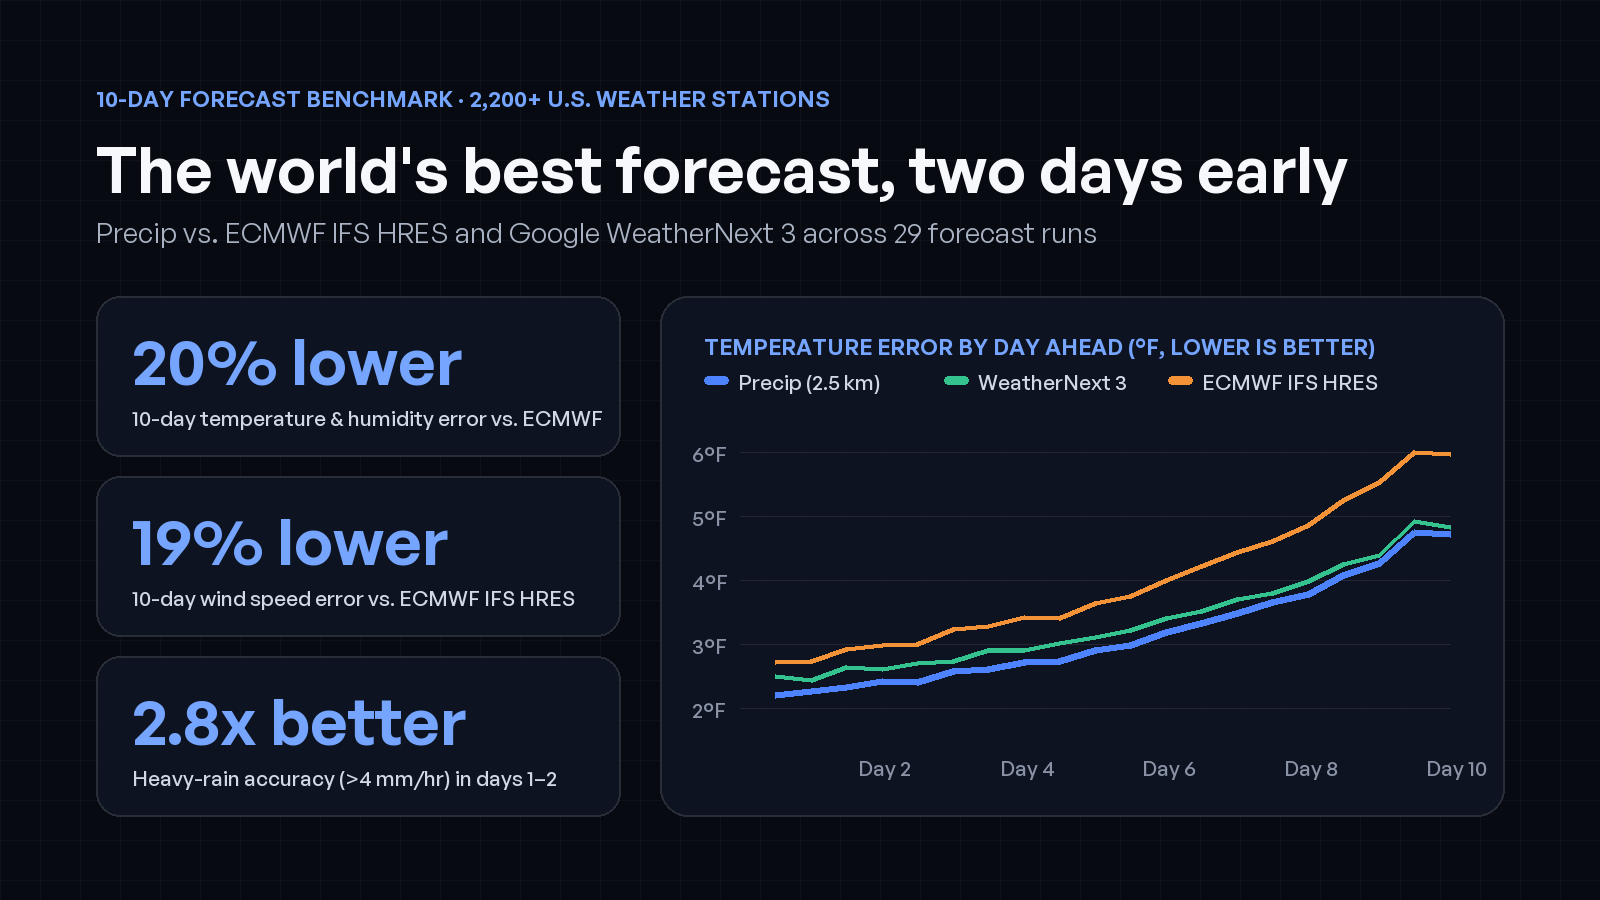
For decades, the European Centre for Medium-Range Weather Forecasts’ high-resolution model (ECMWF IFS HRES) has been the gold standard for 10-day weather forecasts. In the past two years, AI ensemble models led by Google DeepMind’s WeatherNext 3 have matched or surpassed traditional physics models at global scale.
Yet if you open a weather app in a mountain valley, along a coastline, or in the middle of a summer thunderstorm, even those frontier models miss local details that matter.
Today we are publishing our 10-day hourly forecast benchmark and technical whitepaper, evaluating the production 10-day forecast in the Precip app and API against both ECMWF IFS HRES and raw Google WeatherNext 3 across 29 forecast runs (July through October 2026, out to 240 hours) at roughly 2,200 U.S. airport weather stations, 115 NOAA climate reference gauges, and NOAA’s 2.54 km surface analysis.
Across the 75 benchmark tests on the page, Precip achieved the best score in 72 of 75 tests, including all 75 of 75 against raw WeatherNext 3 and 57 of 60 against ECMWF IFS HRES.
Why raw global models miss
Even the best global weather models have two structural blind spots when you read them at a single location:
- A 10 km grid smooths out local terrain.
ECMWF IFS HRES runs at roughly 9 km resolution, and Google WeatherNext 3 outputs on a 0.1° (~10 km) grid. A 10 km grid cell averages elevations across mountain ridges and valleys, blurs sharp sea-breeze fronts along coastlines and the Great Lakes, and smooths over urban heat islands. - Averaging an ensemble smears out heavy rain.
When an ensemble model runs 50 members and averages them together, a thunderstorm that could hit at 2 PM or 4 PM gets smeared into a thin, harmless drizzle across the entire afternoon. Conversely, a single deterministic run like IFS HRES captures storm intensity, but if a storm is displaced by a few miles or an hour, it gets hit with a double penalty (a miss where it rained and a false alarm next door).
How Precip’s blend works
Over the contiguous United States, Precip starts from Google DeepMind’s WeatherNext 3 ensemble and applies two custom post-processing models trained on observational ground truth:
1. Neural downscaling to 2.5 km
Three lightweight neural networks take WeatherNext 3’s 0.1° ensemble mean together with 3DEP elevation, slope, coastline geometry, coordinates, and solar time, and downscale temperature, relative humidity, and 10 m wind speed onto the 2.54 km grid of NOAA’s Unrestricted Mesoscale Analysis (URMA).
That step restores the local temperature inversions, coastal gradients, and terrain-driven winds that a 10 km grid averages away.
2. A multi-model precipitation blend
For the hourly chance of rain, Precip blends the WeatherNext 3 ensemble with the 50-member ECMWF IFS ensemble across all 10 days, and incorporates NOAA’s 3 km High-Resolution Rapid Refresh (HRRR) during the first 48 hours.
For hourly rainfall amounts, our blend sets the amount over the first two days calibrated to the intensity distribution of observed rain, and uses probability-matched WeatherNext 3 from days 3 to 10 (keeping the ensemble mean’s storm placement while restoring the realistic rain rates of individual members).
Two days early
To make sure our models were never tested on weather they had seen during training, the 2.5 km downscaling networks were evaluated out of sample using a two-fold temporal split around September 1, 2026, and the precipitation blend was fitted on eight separate runs excluded from the 29 benchmark runs.
At roughly 2,200 U.S. airport weather stations (ASOS) over all 10 days (4.1 million station-hours):
| Variable (Days 1–10 at ASOS stations) | ECMWF IFS HRES | Google WeatherNext 3 (raw) | Precip | Precip vs. ECMWF |
|---|---|---|---|---|
| Temperature average error (MAE) | 3.71 °F | 3.17 °F | 2.95 °F | 20% lower error |
| Relative humidity average error (MAE) | 10.4% | 8.7% | 8.3% | 20% lower error |
| Wind speed average error (MAE) | 3.43 mph | 3.12 mph | 2.77 mph | 19% lower error |
| Heavy-rain accuracy, Days 1–2 (CSI > 4 mm/hr) | 0.047 | 0.044 | 0.134 | 2.8× higher accuracy |
| Chance-of-rain Brier score, Days 1–2 (USCRN) | N/A | 0.0432 | 0.0284 | 34% lower error vs. WN3 |
Forecast errors grow with each day ahead. When you plot temperature error by lead time at U.S. airport stations, Precip’s error at Day 10 (240 hours) is the same error that ECMWF IFS HRES reaches before Day 8, and Precip’s Day 10 humidity error matches ECMWF before Day 6.
In plain terms: you get the accuracy of an 8-day ECMWF temperature forecast two full days earlier. When you check Saturday’s weather on a Monday morning, you get the same confidence you used to have to wait until Wednesday to see.
Explore the benchmark and whitepaper
Every chart and score table is live on our 10-day forecast benchmark page, and the full methodology, equations, and reference tables are in the benchmark whitepaper (PDF).
Precip’s 10-day hourly forecast is live today in the Precip app on iOS, Android, and the web, and available to engineering teams through the Precip Weather API and MCP server.