Virtual Rain Gauge Map
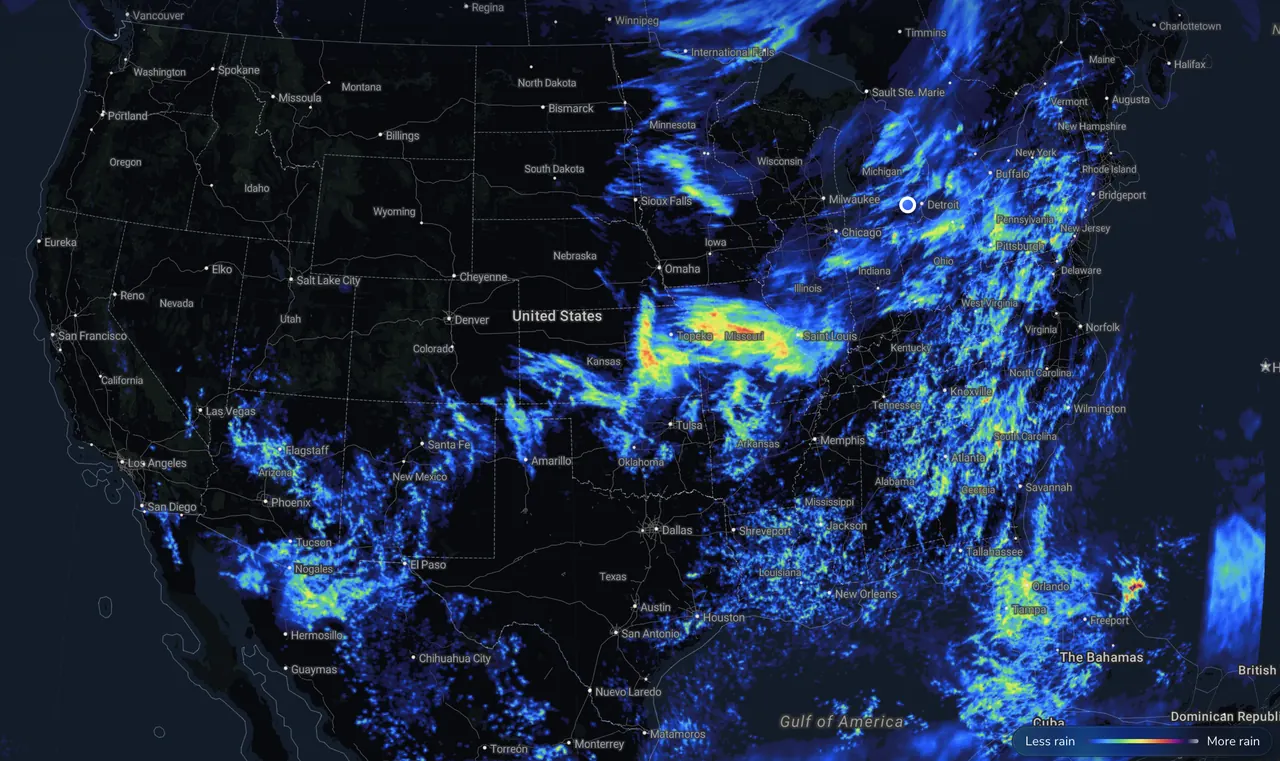
Measured from radar and rain gauges by Precip.
Fri, Nov 13 total: 0.00"
Totals are for the center of Panna Maria, TX 78144 — open the free Precip app or pan the radar map below for your exact address.
The Precip app measured 0.00" of rain in Panna Maria, TX 78144 over the last 24 hours and 2.51" over the past 7 days. So far in 2026, Panna Maria has received 30.82" of rain , 11.2% above average (normal to date: 27.71").
Observed 24-hour daily precipitation totals measured by Precip
Accumulated monthly rainfall compared to 30-year normal averages
| Month | 2026 Total | 30-Yr Normal | vs. Normal |
|---|---|---|---|
| January | 0.68" | 1.75" | −1.07" (−61%) |
| February | 0.34" | 1.55" | −1.21" (−78%) |
| March | 0.24" | 2.53" | −2.29" (−91%) |
| April | 5.83" | 2.46" | +3.37" (+137%) |
| May | 7.77" | 3.88" | +3.89" (+100%) |
| June | 5.90" | 3.21" | +2.70" (+84%) |
| July | 1.92" | 2.69" | −0.77" (−29%) |
| August | 1.11" | 2.28" | −1.17" (−51%) |
| September | 0.56" | 3.67" | −3.11" (−85%) |
| October | 3.93" | 2.75" | +1.18" (+43%) |
| November (to date) | 2.53" | 0.94" | +1.59" (+169%) |
| 2026 YTD Total | 30.82" | 27.71" | +3.11" (11.2% above average) |
Get hyper-local alerts, save unlimited locations, and unlock deeper history in the Precip app.

