Virtual Rain Gauge Map
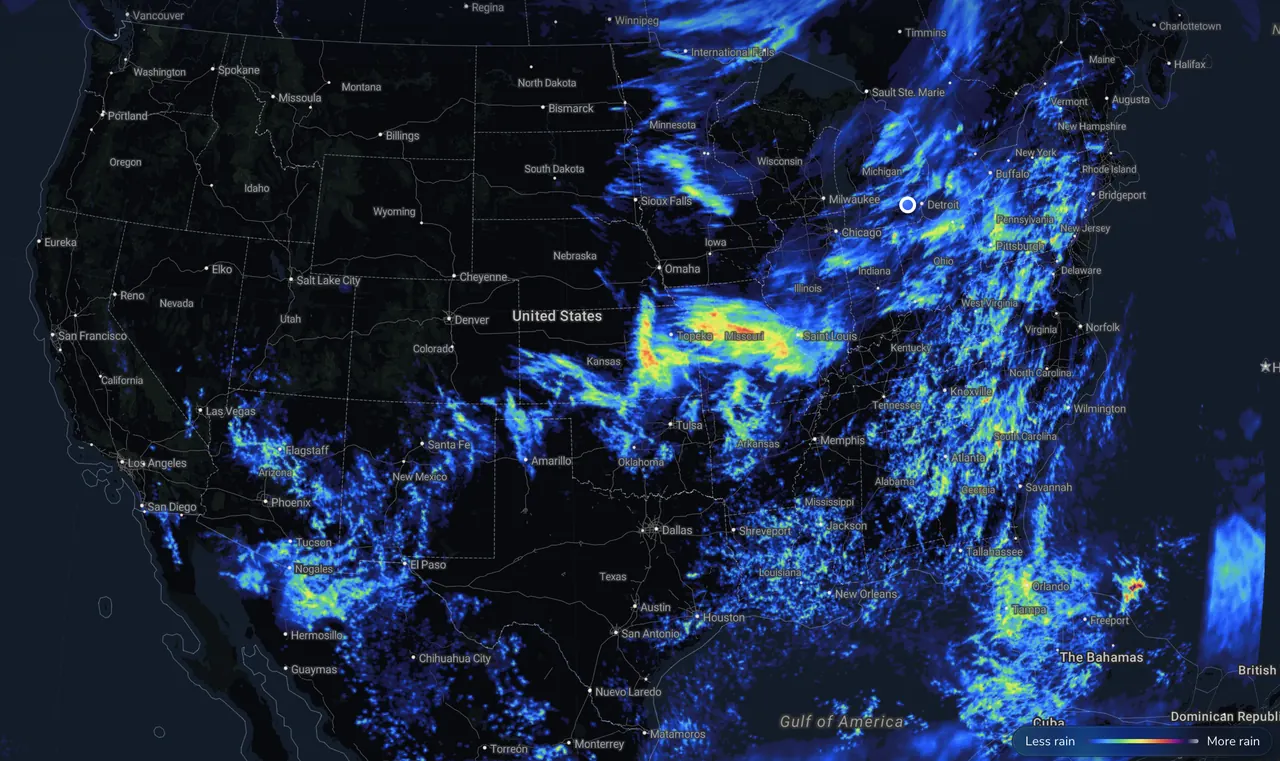
Measured from radar and rain gauges by Precip.
Fri, Nov 13 total: 1.67"
Totals are for the center of Sierra City, CA — open the free Precip app or pan the radar map below for your exact address.
The Precip app measured 0.42" rain + 8.6" snow in Sierra City, CA over the last 24 hours and 1.68" over the past 7 days. So far in 2026, Sierra City, CA has received 33.46" of rain , 34.9% below average (normal to date: 51.43").
Observed 24-hour daily precipitation totals measured by Precip
Accumulated monthly rainfall compared to 30-year normal averages
| Month | 2026 Total | 30-Yr Normal | vs. Normal |
|---|---|---|---|
| January | 6.16" | 11.67" | −5.51" (−47%) |
| February | 10.20" | 11.67" | −1.47" (−13%) |
| March | 1.30" | 10.29" | −8.99" (−87%) |
| April | 8.82" | 5.49" | +3.33" (+61%) |
| May | 2.24" | 3.81" | −1.56" (−41%) |
| June | 0.17" | 1.05" | −0.88" (−83%) |
| July | 0.08" | 0.16" | −0.08" (−51%) |
| August | 0.00" | 0.27" | −0.27" (−100%) |
| September | 1.81" | 0.87" | +0.93" (+107%) |
| October | 0.92" | 3.76" | −2.85" (−76%) |
| November (to date) | 1.78" | 2.40" | −0.62" (−26%) |
| 2026 YTD Total | 33.46" | 51.43" | −17.97" (34.9% below average) |
Get hyper-local alerts, save unlimited locations, and unlock deeper history in the Precip app.

